June Recap and July Outlook
June saw a further complication of the macro situation as U.S. military involvement in Iran was added to ongoing tariff confusion and a worsening of the economic outlook for the balance of 2025 and into 2026. The announcement that a new Fed Chairperson would soon be named essentially created a shadow Fed Chair, increasing the potential for conflicting policy signals that could destabilize markets. If that wasn’t enough, the month also saw the progress through Congress of the “Big, Beautiful Bill” that will potentially massively increase the deficit and a very public breakup between the richest man in the world and the most powerful one.
Somewhat surprisingly, both the bond and the equity markets took headlines and data releases in stride, and both turned in positive performance.
Have investors reached a level of insouciance after months of not knowing where to look next, given the cascade of inputs? Or is news cycle exhaustion creating a very strong case of “see you in September?”
Let’s get into the data:
- Inflation, as measured by CPI, rose less than expected. For the 12 months ended in May, CPI was 2.4%. The monthly number rose 0.1%.
- Non-farm payrolls for June came in at 147,000. The U.S. Bureau of Labor Statistics reported that the labor market added significantly more than the 110,000 jobs that were expected, and the unemployment rate fell to 4.1%.
- The U.S. dollar index has declined by more than 10%. Against a basket of other currencies, the U.S. dollar index hit a three-year low, after peaking on inauguration day.
- GDP expectations were lowered. The Fed’s “dot plot” showed GDP for 2025 falling to 1.4% from 1.7% in March, and 2026 GDP expectations at 1.6% from 1.8%.
What Does the Data Add Up To?
Stable inflation and a solid labor market have likely taken interest rate cuts off the table until later in the year. Despite dire projections of the havoc tariff policy will wreak on the economy, meaningful, measurable data isn’t showing damage yet. The lack of an impact from tariffs so far, specifically with regards to inflation, may be due to businesses not passing on higher import prices to customers. The massive pre-tariff inventory build-up earlier in the year has possibly provided a cushion for businesses to maintain pricing levels, at least until the expected – and touted – tariff deals become a reality.
Markets are forward-looking, and tend to price in future expectations. It’s becoming normal for investors to look beyond the volatility that the administration maintains is part of a negotiating strategy and assume that tariffs will be higher, but manageable, when the dust settles.
The balance of the year may be a story of volatility in the form of a “choppy” stock market that has potential to maintain momentum; a Federal Reserve that ends the year with lower rates, but takes longer to get there, and an economy that chugs along.
Chart of the Month: Consumer Pessimism Returns
After a “relief spike” when tariffs were rolled back in May, consumer confidence turned negative again. Consumers or all age groups reported cited less job availability, worse income prospects, inflation and high prices in their read of the economy.
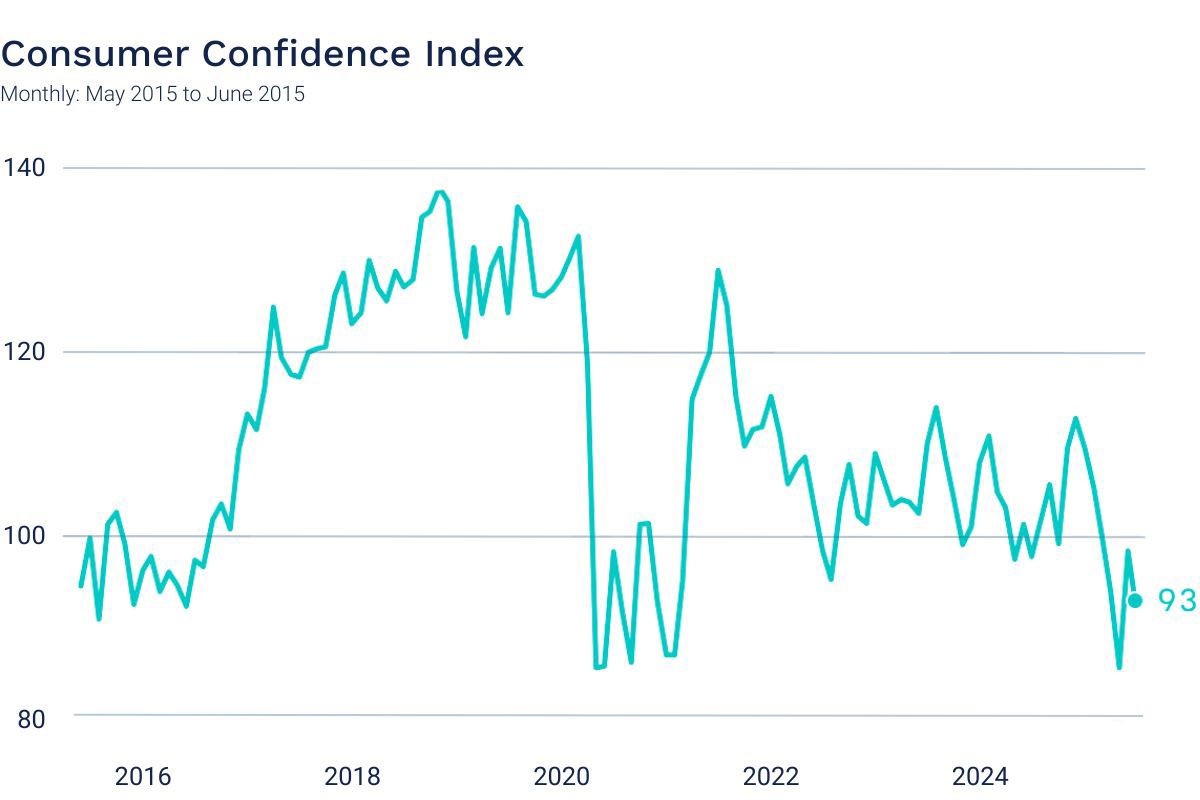
Source: Bureau of Economic Analysis (data) Axios (visual)
Equity Markets in June
- The S&P 500 was up 4.96% for the month
- The Dow Jones Industrial Average gained 4.32% for the month
- The S&P MidCap 400 rose 3.38% for the month
- The S&P SmallCap 600 increased 3.85% for the month
Source: S&P Global. All performance as of June 30, 2025.
Nine of the eleven S&P 500 sectors had positive returns, with Information Technology maintaining the lead for the third month in a row, up 9.73% and Consumer Staples in last place, down 2.21%. The Magnificent Seven added 47% of the index return of 5.09%. Monthly intraday volatility, measured as the daily high/low, decreased again, to 0.83%, but is still historically high.
Bond Markets in June
The 10-year U.S. Treasury ended the month at a yield of 4.24%, down from 4.40% the prior month. The 30-year U.S. Treasury ended June at 4.78%, up from 4.92%. The Bloomberg U.S. Aggregate Bond Index returned 1.54%. The Bloomberg Municipal Bond Index returned 0.62%.
The Smart Investor
Planning for increased volatility in your portfolio means focusing on your own comfort level with risk. Meeting your goals isn’t just about money. The markets have been able to shrug off an escalating level of stressors and still turn in positive performance for the most part, as we hit the mid-point of the year. This can present an opportunity to rethink your investments and reposition to ensure that your risk tolerance and your portfolio investments are aligned.
This work is powered by Advisor I/O under the Terms of Service and may be a derivative of the original.
The information contained herein is intended to be used for educational purposes only and is not exhaustive. Diversification and/or any strategy that may be discussed does not guarantee against investment losses but are intended to help manage risk and return. If applicable, historical discussions and/or opinions are not predictive of future events. The content is presented in good faith and has been drawn from sources believed to be reliable. The content is not intended to be legal, tax or financial advice. Please consult a legal, tax or financial professional for information specific to your individual situation.
This content not reviewed by FINRA
Stay In Touch