December Recap and January Outlook
The weekend after a mid-week New Year’s Eve is usually a slow news cycle. Not this year. 2026 started off with the announcement that the Trump administration had captured Nicolas Maduro, the President of Venezuela.
The United States government’s disapproval of Maduro’s regime goes back to the Biden administration, and the Trump administration had been making no secret of its push to oust Maduro, increasing the U.S. military presence in the Caribbean and tightening economic restrictions on Maduro’s government.
The response from the markets was largely positive, rather than any broader negative implications from increased geopolitical uncertainty. By the time the first week was out, Trump had announced a second wave of attacks had been called off, and American “Big Oil” was in talks with the White House on the rebuilding of the Venezuelan oil infrastructure.
Let’s get into the data:
- Non-farm payrolls for December came in at 50,000. The U.S. Bureau of Labor Statistics reported that the labor market added fewer than the 73,000 jobs that were expected, and the unemployment rate fell to 4.4%.
- The trade deficit declined. The U.S. Bureau of Economic Analysis announced a deficit of $29.4 billion, a 39% drop month-over-month and the lowest level since 2009.
- Productivity increased. The U.S. Bureau of Labor Statistics reported that productivity rose at a 4.9% annual rate in the third quarter.
- The University of Michigan Consumer Sentiment Index rose by 2 percentage points. For the second month in row, consumers reported feeling more positive, with inflation expectations holding steady.
- The Atlanta Fed’s GDPNow model estimate for real GDP growth (seasonally adjusted annual rate) in the fourth quarter of 2025 doubled to 5.4%.
What Does the Data Add Up To?
The Fed ended the year with a much-anticipated 25 basis point rate cut but signaled a more cautious stance going forward. The unemployment rate for December came down, and even though jobs missed the estimate, they still turned in positive, if anemic, growth. While the labor market is growing robustly, it isn’t shrinking, which would appear to make it unlikely that the Fed will rush into further rate cuts.
Chairman Powell’s term ends in May, and it is entirely possible that rates will be on pause until the June meeting under the new Chairman.
The bigger story in the data is the massive boost to productivity. Output rose to 5.4% rate in the third quarter, but hours worked increased only 0.5%. Increased productivity will drive GDP and eventually incomes higher over time, both positives for the longer-term health of the economy. What is causing the increase?
AI has long been touted as a driver of productivity increases, and the business-positive policies of the Trump administration around taxes and deregulation are designed to spur business investment. But the productivity story began several years ago. We could be seeing the results of investments in automation made during the pandemic. The labor market itself may be telling a part of the story. We’ve consistently seen that people are not seeing as much opportunity in the labor market and are staying in their jobs longer. This lower job “churn” could be helping to increase output.
The data on the economy is largely positive, but data is not the only narrative. Since the 2000s Permian Basin shale oil boom, not many of us have probably given much thought to any other forms of crude oil and what they are used for. Whether Big Oil can, or wants to begin refining “heavy, sour” crude remains to be seen, but will likely be making headlines for months. As we head into an election year, there will be more headlines, and they will at least temporarily move markets.
Chart of the Month: Consumer Sentiment Upswing
Consumer spending is critical to the economy, and after trending downward for most of 2025, consumers are finally seeing light at the end of the tunnel.
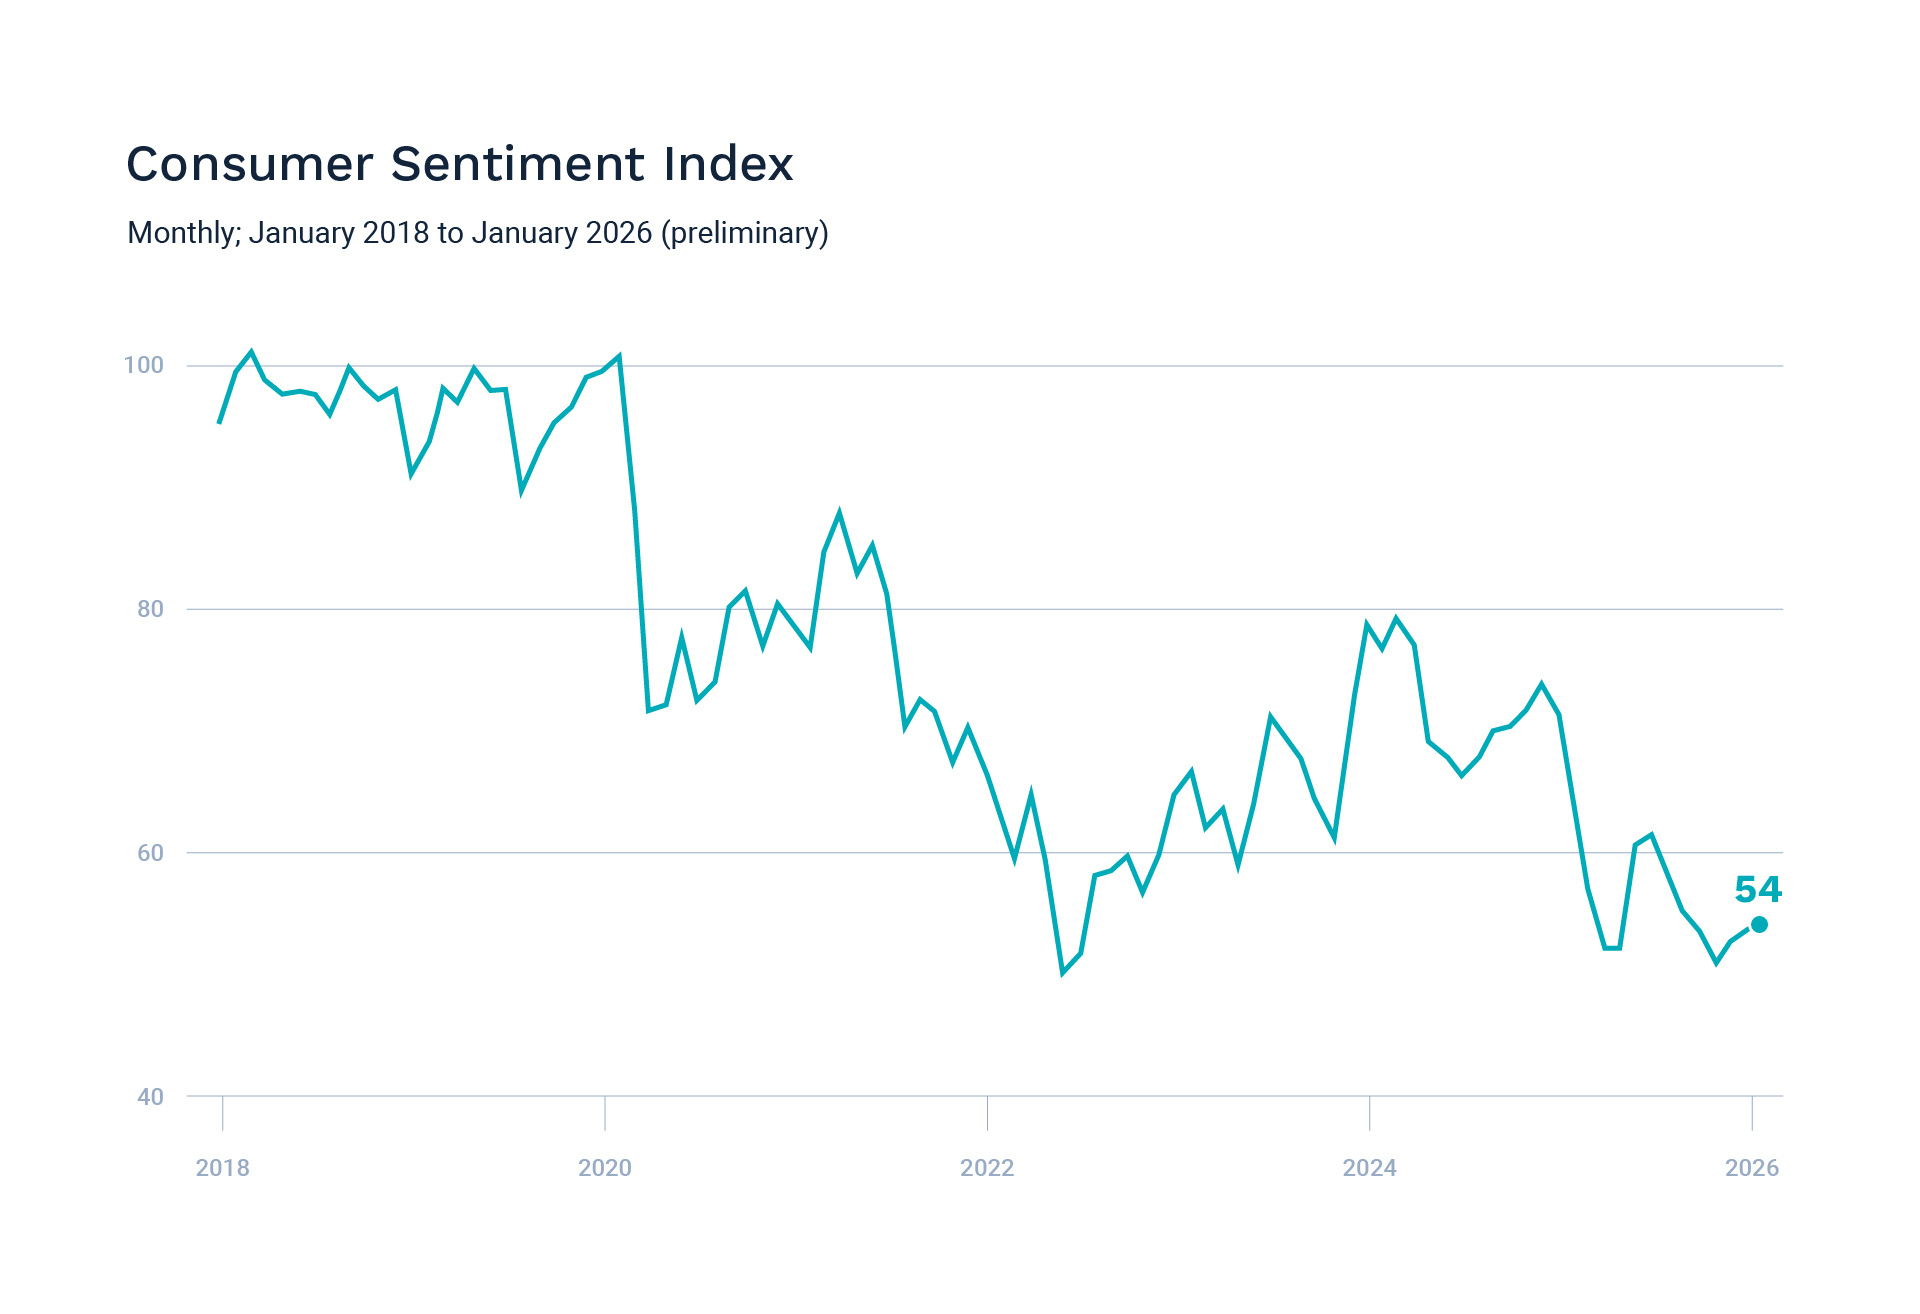
Source: University of Michigan; Axios Visuals
Equity Markets in December
- The S&P 500 was down 0.05% for the month, turning in 16.39% for the year
- The Dow Jones Industrial Average gained 0.73% for the month and was up 12.97% for 2025
- The S&P MidCap 400 fell 0.10% in December, shaving a bit off the year to end at 5.90%
- The S&P SmallCap 600 dropped 0.26%, for a year end performance of 4.23%
Source: S&P Global. All performance as of December 31, 2025.
Ten of the eleven S&P 500 sectors had positive returns for the year, with Communication Services turning in the best performance and Real Estate the worst. Volatility increased 31% over 2024 levels. In December, the VIX, the market’s risk index, declined to its lowest levels of the year after spiking in April Breadth declined, with the Magnificent Seven again turning in a significant chunk of performance, and accounts for 34.9% of the market value.
Bond Markets in December
The 10-year U.S. Treasury ended the month at a yield of 4.17%, up from 4.02% the prior month. The 30-year U.S. Treasury ended November at 4.85%, up from 4.67%. The Bloomberg U.S. Aggregate Bond Index returned 0.25% in December and 7.30% for the year. The Bloomberg Municipal Bond Index returned 0.18% for the month and 4.25% for 2025.
The Smart Investor
The new year brings an opportunity to reassess goals and tune up your financial plan. The year behind us saw increased volatility, and while markets ended up positive, if the ride made you uncomfortable, it’s a good time to reassess your risk tolerance and your investments.
Rates are likely to continue dropping, so if you’ve been holding off on taking out a mortgage or home equity line of credit, this may be the year to jump into it.
Thinking about your plan from all angles, including income, debt, budgeting, savings and investing, can help you get a good perspective on where you are at before you move forward.
We’re always available for a discussion to keep your financial journey moving forward smoothly.
This work is powered by Advisor I/O under the Terms of Service and may be a derivative of the original.
The information contained herein is intended to be used for educational purposes only and is not exhaustive. Diversification and/or any strategy that may be discussed does not guarantee against investment losses but are intended to help manage risk and return. If applicable, historical discussions and/or opinions are not predictive of future events. The content is presented in good faith and has been drawn from sources believed to be reliable. The content is not intended to be legal, tax or financial advice. Please consult a legal, tax or financial professional for information specific to your individual situation.
This content not reviewed by FINRA
Stay In Touch