January saw an increase in volatility, as geopolitical tensions centered around tariffs and the Trump administration’s increasing bellicosity about Greenland made headlines. The S&P 500 eked out a 1.45% positive return, keeping a three-year winning streak alive. The Fed held rates steady at the January meeting, and Kevin Warsh, President Trump’s pick to replace Jerome Powell as Fed Chairman began to build support for confirmation.
In early February AI disruption took center stage as the SaaS (software as a service) economy began to appear vulnerable to the idea that companies could inhouse the services they now pay for monthly by replacing them with increasing powerful and customizable AI. Software stocks took a hit and are likely to remain more volatile as headlines drive the market. Most observers seemed to feel that the “Saas-pocalypse” is premature, but it didn’t stop investors from promptly rotating out of tech and into materials, industrial and financial stocks.
Labor data for January was late in arriving but made up for it with a big positive surprise.
The Supreme Court’s ruling against the administration on tariffs was immediately followed by the imposition of a new 10% global tariff, followed by a 15% tariff announcement on Monday, roiling markets.
Let’s get into the data:
- Non-farm payrolls for January came in at 130,000. The U.S. Bureau of Labor Statistics reported that the labor market added more than double the 55,000 jobs that were expected, and the unemployment rate fell to 4.3%.
- Inflation moderated. The Bureau of Labor Statistics reported that the consumer price index for January grew 2.4% from twelve months ago, down 0.3 percentage point from December. This marked the lowest reading since May 2025.
- The University of Michigan Consumer Sentiment Index was up slightly. The index rose to 56.6, from 56.4 in January. Sentiment continues to be “K-Shaped” as wealthier consumers are becoming more positive while sentiment is declining for lower-income groups.
- Fourth quarter GDP missed estimates. GDP rose at an annualized rate of 1.4%, significantly below the Dow Jones estimate of a 2.5% gain.
What Does the Data Add Up To?
Stronger labor data and a weaker economy would seem to give the Fed some impetus to re-start rate cuts. However, Federal Reserve Governor Waller, in a speech on February 23rd, indicated that one month of solid labor market growth isn’t enough to define a trend. He pointed to the full year of 2025, which was the weakest for job creation in a non-recession year since 2002. In discussing GDP, he indicated that the government shutdown last year likely shaved a percentage point from the fourth quarter and boosted the first quarter of 2026 by the same amount. Smoothing those effects, according to Governor Waller, leaves an expectation of GDP above 2% for the two quarters together.
Chairman Powell’s term ends in May, and it is entirely possible that rates will be on pause until the June meeting under the new Chairman.
The big news was the Supreme Court striking down tariffs imposed under the International Emergency Powers Act. The initial response from market observers was that spikes in trade policy uncertainty, and related sell-offs in the markets, would decrease. Even with the new tariffs announced by the President after the ruling, the effective tariff rate will be lower, according to new research published by The Budget Lab at Yale. This should bring some much-needed relief on costs for U.S. households, and provide some stability on inflation.
Chart of the Month: Labor Surprises on the Upside
Healthcare led the way with a gain of 82,000 jobs in January. A strengthening labor market and weaker GDP may be enough to push the Fed back to lowering rates.
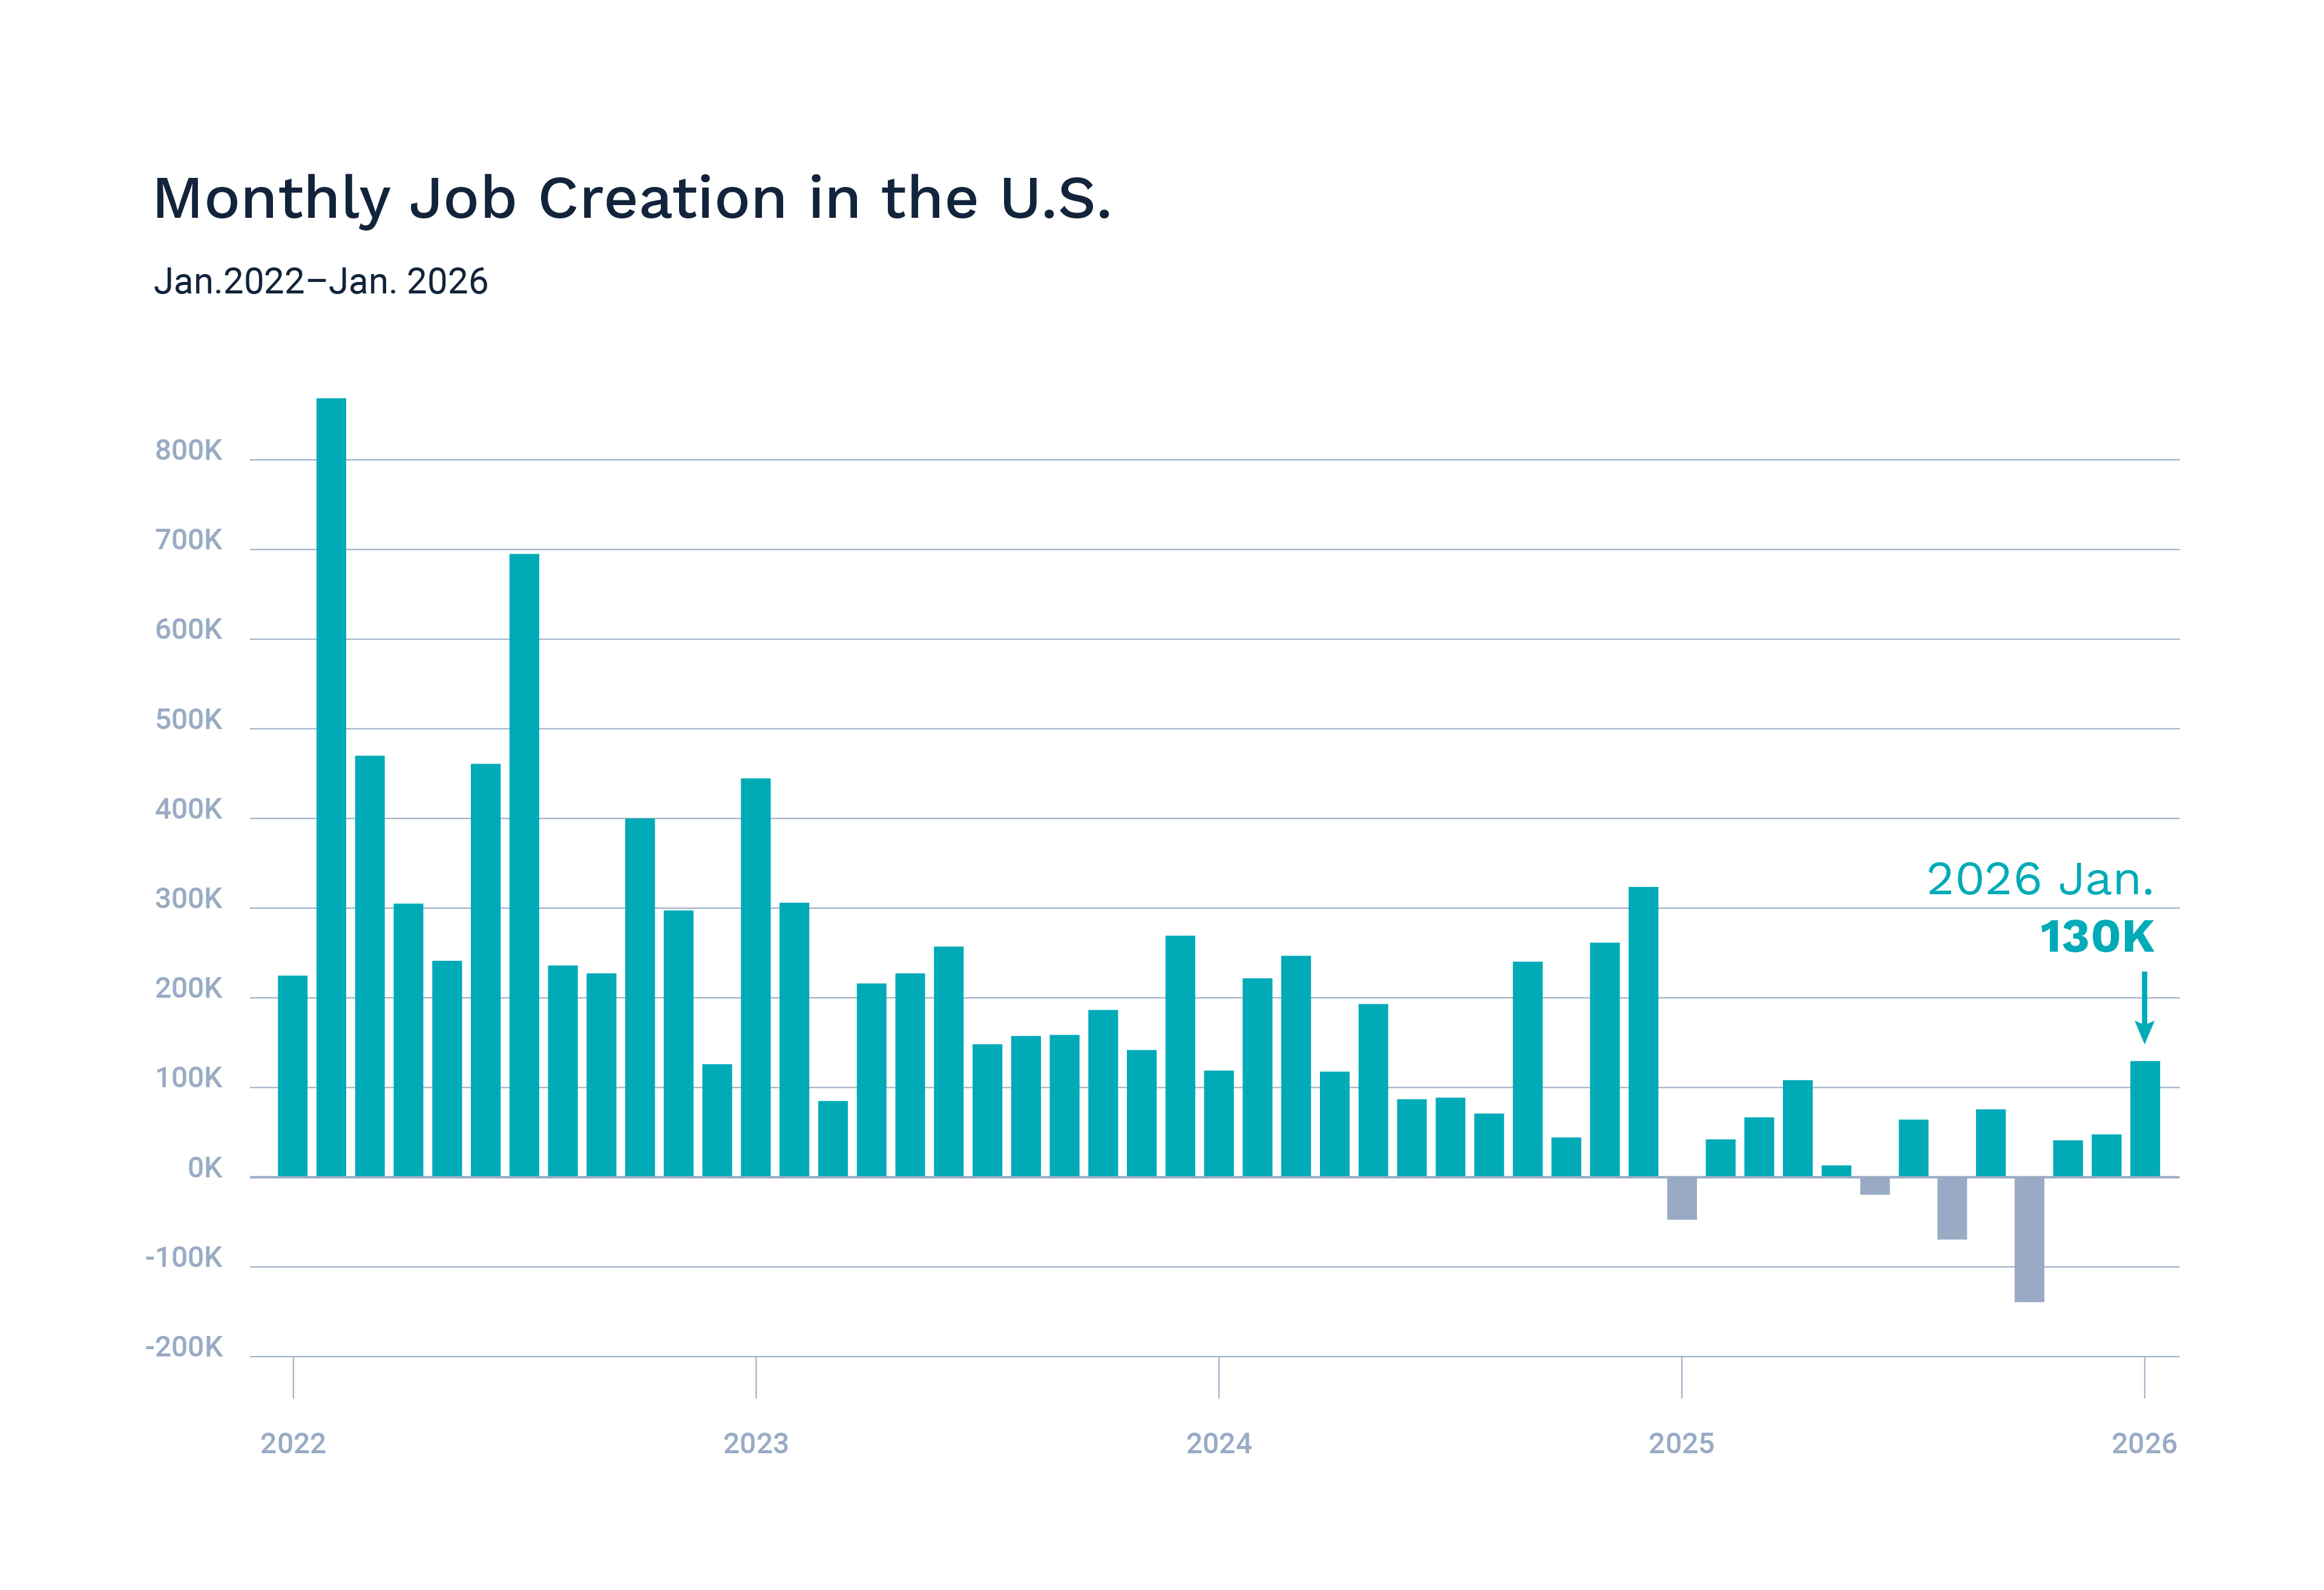
Source: Bureau of Labor Statistics; Axios Visuals
Equity Markets in January
- The S&P 500 was up 1.4% in January
The January “barometer” had a positive reading, which has potential implications beyond just this month of data. Over the last 40 years, there were 25 years in which January returns were positive. Of the 25 years, the full year returns were positive 84% of the time.
Turning to the specifics of January 2026, The Charles Schwab Trading Activity Index (the STAX) rose to 49.96 from 48.48 in December, reflecting investors growing confidence in the market. Broken down by age demographics, Gen X were the most buyers over the month.
Bond Markets in January
The 10-year U.S. Treasury ended the month at a yield of 4.24%, up from 4.17% the prior month. The 30-year U.S. Treasury ended January at 4.84%, up from 4.80%. The Bloomberg U.S. Aggregate Bond Index returned 0.11% in January. The Bloomberg Municipal Bond Index returned 0.94% for the month.
The Smart Investor
The new year is off to a galloping start, with likely volatility and headline-driven market surges and downturns. AI disruption is now the new watchword.
What should you focus on? Yourself, your goals, your plans.
Building a financial plan that can withstand market shocks and is flexible enough to find opportunity is all about asset allocation. Understanding your risk tolerance, your financial needs, and where you are on your financial journey is the key to keeping your plan on track.
As you begin a new year, it can be a good time to dive in a little deeper. Do you understand your own “money story?” What drives you to make financial decisions? What are your fears?
Taking care of the saving and investing is just part of it.
We’re always available for a discussion to keep your financial journey moving forward smoothly.
This work is powered by Advisor I/O under the Terms of Service and may be a derivative of the original.
The information contained herein is intended to be used for educational purposes only and is not exhaustive. Diversification and/or any strategy that may be discussed does not guarantee against investment losses but are intended to help manage risk and return. If applicable, historical discussions and/or opinions are not predictive of future events. The content is presented in good faith and has been drawn from sources believed to be reliable. The content is not intended to be legal, tax or financial advice. Please consult a legal, tax or financial professional for information specific to your individual situation.
This content not reviewed by FINRA
Stay In Touch